
How do you measure success in content creation?
You measure content success by tying each piece to a goal and tracking the metrics that show progress toward it. For most businesses, that means four layers: whether people find the content (search visibility and traffic), whether they engage with it (engagement rate and time), whether it moves them toward a purchase (leads, sign-ups and assisted sales) and whether it earns its cost (return on the time and money spent).
Page views alone do not tell you much. A post with modest traffic that brings in qualified leads can be worth more than a viral post that brings no customers. This guide explains which content metrics matter, how to set them up in Google Analytics 4 (GA4) and Google Search Console, and how to report on them in a way that leads to better content. At PROSeCommerce, part of PROS Global in San Diego, we use this framework to review blog and product content for online stores.
Start with goals, not metrics
Before choosing metrics, decide what each piece of content is for. Different content has different jobs:
| Content type | Main goal | Primary metrics |
|---|---|---|
| SEO blog posts and guides | Attract new visitors from search | Impressions, clicks, CTR, organic sessions |
| Buying guides and comparisons | Help shoppers choose | Engagement rate, clicks to products, assisted purchases |
| Product and category copy | Turn visits into sales | Add-to-cart rate, conversion rate, revenue |
| Email newsletters | Keep customers coming back | Click rate, sessions from email, repeat purchases |
| Lead magnets (guides, checklists) | Capture contacts | Sign-ups, cost per lead, lead-to-customer rate |
| Video and social content | Build awareness | Views, watch time, followers, referral sessions |
Write the goal and the one or two main metrics into your content brief before you start writing. It makes success easy to judge later and keeps the piece focused.
Layer 1: Visibility and reach
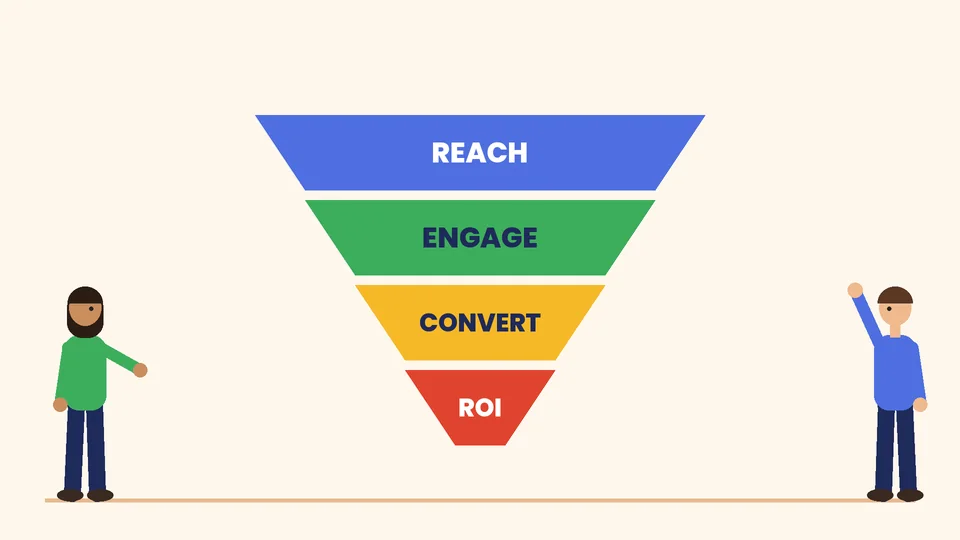
Visibility metrics show whether your content is being found. For search, the best source is the Performance report in Google Search Console, which reports:
- Impressions: how many times your site appeared in search results.
- Clicks: how many times someone clicked through to your site from Google Search.
- CTR (click-through rate): clicks divided by impressions.
- Average position: the average position of your topmost result.
Filter by page to see each post’s queries. A post with high impressions and a low CTR needs a better title and description; a post with few impressions may need better targeting or more depth. Our guide to optimizing for the SERP covers how to improve titles, snippets and rich results.
For other channels, track reach where it happens: email list size and opens in your email platform, views and followers on social platforms, and referral sessions in GA4.
Layer 2: Engagement
Engagement metrics show whether people actually read or use the content once they arrive. In GA4, the main measures are built on the idea of an engaged session.
Google’s help page on engagement rate and bounce rate defines an engaged session as one that lasts longer than 10 seconds, has a key event, or has at least 2 pageviews or screenviews. Engagement rate is the percentage of sessions that were engaged, and bounce rate is the percentage that were not.
Useful engagement metrics for content include:
- Engagement rate per page or landing page.
- Average engagement time, the time the page was actually in focus.
- Scroll depth, if you track scroll events, to see how far readers get.
- Clicks on internal links and product links from the post.
- Returning users who come back to read more.
Compare similar content types with each other rather than with your whole site. A short FAQ page and a long buying guide will naturally have different engagement times.
Layer 3: Conversions and leads
This is where content proves its business value. In GA4, actions that matter to your business are tracked as key events. Google’s explanation of key events describes a key event as an event that measures an action particularly important to the success of your business; “conversion” now refers to key events used to measure and optimize ad campaigns.
GA4’s recommended events include names such as generate_lead, sign_up and purchase. For a store’s content, useful key events include:
- Newsletter or lead magnet sign-ups.
- Contact or quote form submissions.
- Add-to-cart and purchase events that start on a content page.
- Clicks to call or to chat.
Track campaigns with UTM parameters
When you share content in emails, social posts or partner sites, add UTM parameters to the links so GA4 can attribute the visits. Google’s URL builder guide lists the main ones: utm_source (for example, newsletter), utm_medium (for example, email) and utm_campaign (for example, spring_sale). Use a consistent naming convention, or your reports will split one campaign into several.
Understand attribution
Content rarely makes the final sale on its own. Someone might read a guide, leave, return through an email and then buy. GA4’s attribution reports assign credit to touchpoints along the path using models such as data-driven attribution and paid and organic last click. Look at both the landing page that started a session and the pages viewed before a purchase to see which content assists sales.
Layer 4: Return on content
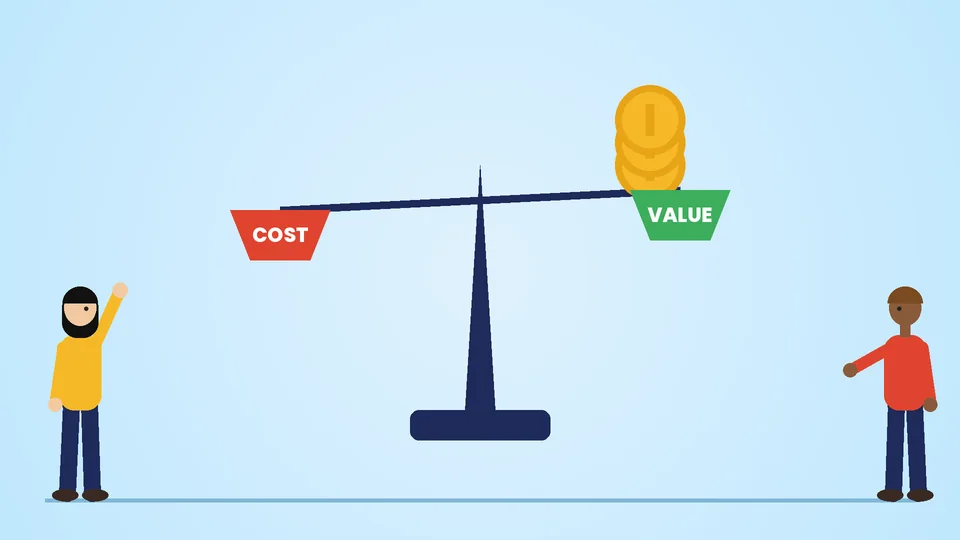
To decide where to invest, compare what content produces with what it costs.
- Add up the cost of each piece: writing, editing, design, images, video and promotion. Include internal time at a fair hourly rate.
- Estimate the value it produced: revenue from purchases it started or assisted, plus the value of leads (average lead-to-customer rate multiplied by average order value or customer value).
- Compare over a fair period. Search content often takes months to build traffic, so judge it over several months, not the first week.
You can express the result as a simple return on investment: value minus cost, divided by cost. Even a rough estimate helps you see which topics and formats are worth repeating. Be clear in reports about which figures are measured and which are estimates.
How to set up content measurement step by step
- Connect GA4 and Search Console for your site so you can see search queries next to on-site behavior.
- Mark your key events in GA4, such as sign-ups, form submissions and purchases.
- Make sure ecommerce events are firing if you run a store, so purchases and revenue appear in reports.
- Group content by type or topic, for example with a consistent URL structure or a content group parameter, so you can compare groups.
- Use UTM parameters on every link you share outside your site.
- Build a simple dashboard with the main metric for each content goal.
- Set a review schedule: a light monthly check and a deeper quarterly review.
Example: measuring a buying guide
Say an outdoor gear store publishes a guide to choosing hiking boots. A simple measurement plan could look like this:
- Goal: help shoppers choose a boot and send them to the right product pages.
- Visibility: track impressions, clicks and CTR in Search Console for queries such as “how to choose hiking boots.”
- Engagement: track engagement rate, average engagement time and clicks on the product links in the guide.
- Conversions: track add-to-cart and purchase events in sessions that included the guide, plus sign-ups for a boot care email series.
- Return: compare the cost of writing, photos and promotion with the assisted revenue over the first six months.
If the guide gets impressions but few clicks, rewrite the title and description. If readers arrive but rarely click to products, make the product links more visible and match them to each section. If they click but do not buy, check the product pages themselves.
Build a content report people will use
A good content report answers three questions: what happened, why and what you will do next. Keep it short.
- Top performers: posts with the most organic clicks, sign-ups or assisted revenue.
- Opportunities: posts with high impressions and low CTR, or high traffic and low engagement.
- Decliners: posts losing clicks over the last few months, which may need an update.
- Next actions: a short list of pages to refresh, merge, expand or promote.
Updating existing content is often the fastest win. Refreshing a post with current facts, clearer answers and better internal links can bring back lost traffic for less effort than writing something new.
To connect content results to your wider plan, see our guides to building a digital marketing strategy and sales funnel stages. For turning content visitors into buyers, our Shopify conversion rate optimization guide covers the on-site side.
Common content measurement mistakes
- Chasing page views without checking whether visitors engage or convert.
- Judging search content too early, before it has had time to rank.
- Ignoring assisted conversions and only crediting the last page before purchase.
- Inconsistent UTM naming, which splits campaign data.
- Tracking too many metrics so no one knows which one matters.
- Never acting on the data. Measurement is only useful if it changes what you publish next.
Frequently asked questions
What are the most important content marketing metrics?
What is a good engagement rate in GA4?
How long does it take to see results from content marketing?
How do I track leads from blog posts?
What is the difference between a key event and a conversion in GA4?
How often should I review content performance?
Measure what matters, then improve it
Successful content creation is measured in layers: visibility, engagement, conversions and return on investment. Set a goal for each piece, track the matching metrics in Search Console and GA4, report on them simply and use the findings to decide what to write and update next. If you would like help building a content plan and measurement setup for your online store, contact PROSeCommerce.