
What is a conversion rate, and how do you use it to grow revenue?
A conversion rate is the percentage of visitors (or sessions) that complete a defined action. For an online store, that action is often a purchase. Shopify’s Help Center describes conversion rate in its behavior reports as the percentage of online store sessions that resulted in a purchase, and it also breaks the path into cart additions, checkout reached and checkout completed. Knowing that number matters because revenue is not only about traffic. If more of the people who already visit you buy, or buy more often, revenue can rise without a larger ad budget.
This guide defines conversion rate, shows how to calculate it, explains ecommerce funnels, lists practical levers you can test, and gives a weekly measurement routine. At PROSeCommerce, part of PROS Global Inc in San Diego, we help merchants read conversion data without inventing industry averages. Report definitions below were checked on Shopify Help as of November 2026.
How to calculate conversion rate
The basic formula is:
Conversion rate = (conversions ÷ visitors or sessions) × 100
Example: if 50 purchases came from 1,000 sessions, the purchase conversion rate is 5%. Always name the denominator. Session-based rates and user-based rates are not interchangeable, and platform reports may use sessions.
Pick one primary conversion for leadership reporting (usually purchase). Track secondary conversions separately: add to cart, email signup, quote request or account creation. Mixing them into one “conversion rate” hides where the leak is.
The ecommerce conversion funnel
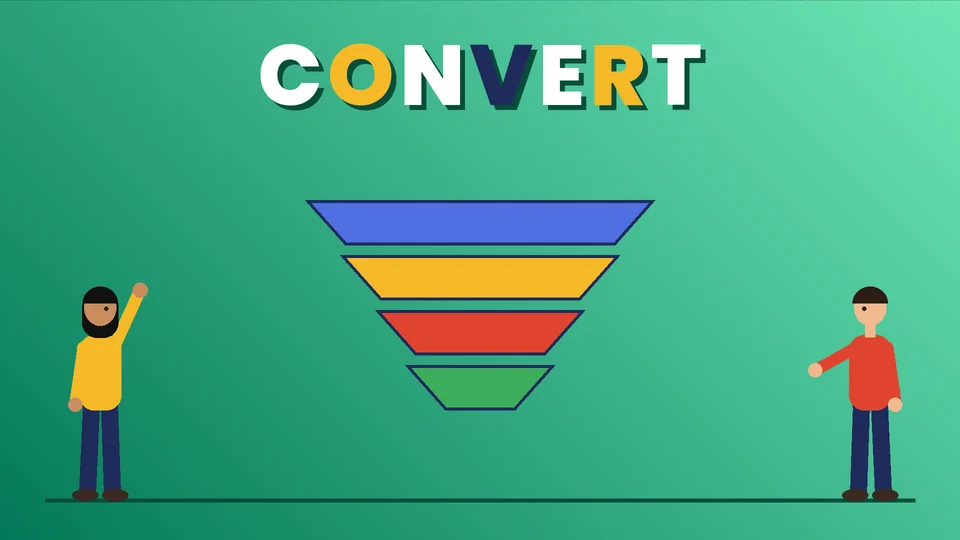
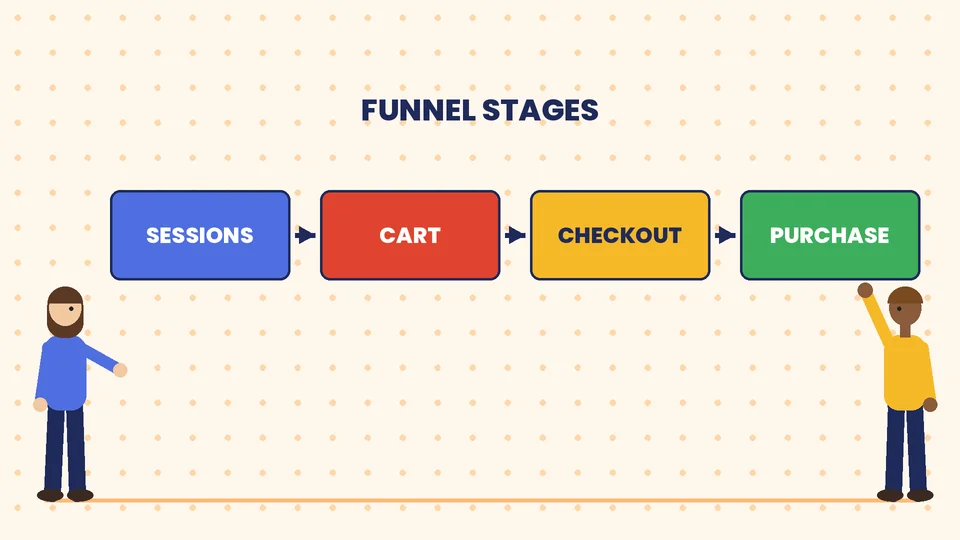
Shopify’s Conversion rate breakdown report visualizes the path visitors take through the store and checkout. In that model, stages include sessions, sessions with cart additions, sessions that reached checkout and sessions that completed checkout. Each step’s rate is calculated against total sessions in Shopify’s description of the report.
That funnel gives you a map:
| Stage | Question to ask |
|---|---|
| Visit → product engagement | Can people find the right product quickly? |
| Product → cart | Are prices, shipping cues and trust signals clear? |
| Cart → checkout | Is the cart confusing, slow or missing shipping estimates? |
| Checkout → purchase | Are there too many fields, surprise fees or payment failures? |
Fix the largest drop-off first. A beautiful homepage does not help if checkout fails on mobile.
Why conversion rate and revenue move together
Revenue can be thought of as:
Traffic × conversion rate × average order value
Improving any one factor helps, but conversion work often has a better return than buying more traffic into a broken funnel. If you spend more on ads while checkout is painful, you pay to send more people into the same leak.
Still, conversion rate is not the only KPI. A campaign that brings lower-intent traffic can lower the rate while still adding profitable sales. Always read conversion rate next to revenue, margin and the traffic source.
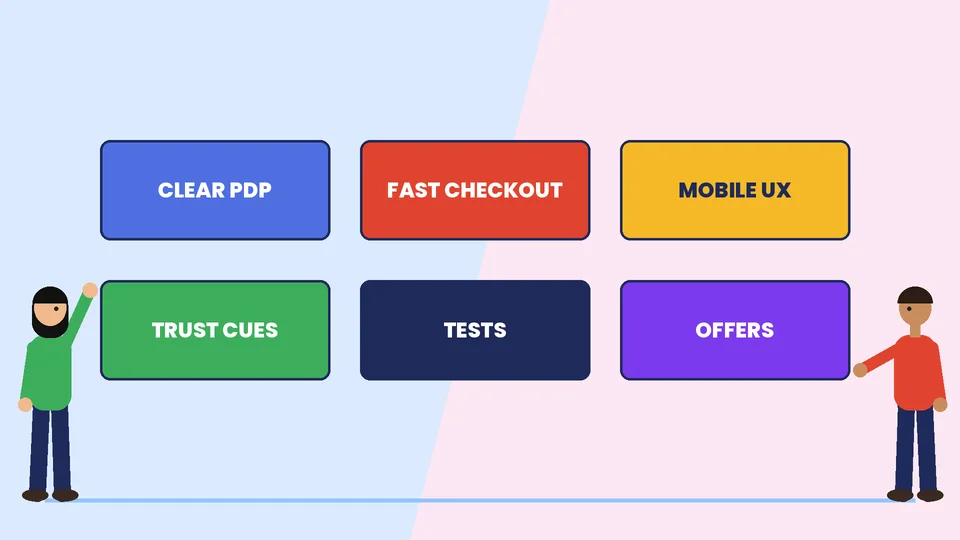
Practical levers that usually move conversion rate
1. Clarity on product pages
Shoppers convert when they understand what they get, what it costs, when it arrives and how returns work. Lead with the product name, price, key specs and primary call to action. Use clear photos. State shipping and return rules near the buy button. For trust and proof patterns, see our guide on using customer reviews and proof.
2. Faster, simpler paths to checkout
Every extra step is a chance to leave. Reduce forced account creation when guest checkout is possible. Show shipping costs early. Keep payment options visible. Avoid surprise fees at the last step.
3. Mobile experience
A large share of ecommerce sessions happen on phones. Buttons must be tappable, forms must fit the screen and payment methods people expect on mobile should work. Test the full purchase path on a real device, not only in a desktop browser.
4. Trust and security cues
People hesitate when a store looks unfinished. Display contact details, policies and recognizable checkout security. Payment setup still matters; review secure payment gateway features and your wider ecommerce security checklist.
5. Merchandising and offers
Bundles, clear discounts with honest conditions and relevant recommendations can raise conversion rate or average order value. Keep offers readable. Hidden exclusions create refunds and chargebacks later.
6. Testing with discipline
Change one meaningful thing at a time when you can, or run proper A/B tests when traffic supports them. Our A/B testing guide for ads, creatives and email covers test hygiene. Do not declare winners from a day of data.
How Shopify merchants can read the built-in reports
If you run Shopify, start inside Analytics behavior reports:
- Conversion rate over time shows sessions, cart additions, checkout reached, checkout completed and conversion rate by time grouping.
- Conversion rate breakdown shows the funnel visualization described in Shopify Help.
Export or screenshot a baseline before you redesign a theme section. After a change, compare the same date range length and watch for seasonality. App pixel issues can distort numbers, so verify tracking after theme or tag changes.
A weekly conversion review routine
Block 45 minutes each week:
- Record purchase conversion rate, sessions, orders and revenue.
- Note the largest funnel drop-off versus last week.
- Pick one hypothesis (for example, “shipping cost appears too late on mobile product pages”).
- Ship one fix or launch one test.
- Log the result in a simple spreadsheet: date, change, metric, outcome.
This beats quarterly “redesign everything” projects that you cannot attribute.
Conversion rate by channel and device
Segment before you panic. Paid social traffic often converts lower than branded search. Mobile may convert lower than desktop but still produce most of your growth. Improve the weak segment that carries enough volume to matter. For broader acquisition planning, connect this work to your digital marketing strategy and sales funnel stages.
What not to do
- Chase a competitor’s claimed rate. You rarely know their traffic mix, margins or how they define conversion.
- Invent “average ecommerce conversion rates” in reports without a named, dated source. If you lack a source, say so.
- Optimize only the homepage. Money is usually won or lost on product, cart and checkout pages.
- Stack five apps that each add popups. Interstitial overload hurts usability.
- Ignore site speed after installing scripts. Slow pages tax every step of the funnel.
Examples of conversion definitions worth tracking separately
Not every valuable action is a purchase. Define them in writing so your team does not argue about the dashboard later.
| Conversion | Typical use |
|---|---|
| Purchase / paid order | Primary revenue KPI |
| Add to cart | Merchandising and product-page quality |
| Begin checkout | Cart and shipping-estimate quality |
| Email or SMS signup | List growth; not a substitute for sales |
| High-intent form (wholesale, custom quote) | B2B or made-to-order businesses |
Report each rate on its own row. A spike in email signups after a popup test can look like “conversion improved” while purchase rate is flat or down.
Diagnostics when conversion rate falls
Work through this order before redesigning the brand:
- Tracking. Did a new app, theme update or tag manager change break the purchase pixel or Shopify’s own reports?
- Traffic mix. Did a large low-intent campaign start? Compare conversion rate by channel.
- Site errors. Check theme editor changes, payment provider outages and mobile checkout bugs.
- Offer and price. Did a sale end, a competitor undercut you or shipping rates jump?
- Seasonality. Compare to the same week last year when you have history.
Only after those checks should you brief a designer. PROSeCommerce sees many “conversion emergencies” that were actually analytics or traffic-mix issues.
Average order value still belongs in the conversation
Raising conversion rate with steep discounts can hurt profit. Watch contribution margin and average order value (AOV) beside conversion rate. Sometimes a small conversion dip is acceptable if AOV and margin rise. Put those three numbers on the same weekly scorecard.
Page-level ideas that are safe to test
- Move shipping cost hints higher on the product template
- Replace vague buttons (“Submit”) with specific ones (“Add to cart”)
- Reduce redundant form fields at checkout
- Add size guides or comparison charts where returns are high
- Show delivery date estimates when your operations can honor them
- Limit simultaneous popups to one primary message
Each idea still needs your data. A luxury brand and a consumables brand will not share the same winning pattern.
Related CRO reading on this site
Conversion rate is the metric; conversion rate optimization (CRO) is the ongoing process of improving it. We cover the process angle in the importance of conversion rate optimization.
Frequently asked questions
What is a good ecommerce conversion rate?
Should I track conversion rate by sessions or users?
How is conversion rate different from click-through rate?
Can a lower conversion rate still mean more revenue?
What should I fix first if my funnel drops at checkout?
How often should I change my store to improve conversions?
Turn conversion rate into a management habit
Write the definition of a conversion at the top of every report so new teammates do not mix signup rate with purchase rate. Conversion rate tells you how effectively your site turns attention into action. Define the goal, measure the funnel, fix the biggest leak and keep a written log. If you want help prioritizing conversion work on a Shopify or other ecommerce stack, contact PROSeCommerce and we will help you build a practical plan from your real reports.
Sources
- Shopify Help Center, Behavior reports (conversion rate breakdown and conversion rate over time): https://help.shopify.com/en/manual/reports-and-analytics/shopify-reports/report-types/default-reports/behaviour-reports
- Shopify Help Center, Optimizing your site structure for search engines (site quality checklist for conversions): https://help.shopify.com/en/manual/promoting-marketing/seo/optimize-site